If you’ve ever seen a dyno graph after ECU tuning, you might have wondered:
👉 What do these curves actually mean?
👉 How do you know if your tuning is good or bad?
Understanding a dyno graph is one of the most important skills for any tuner, workshop owner, or car enthusiast in India.
In this guide, we’ll break down everything you need to know about dyno graphs—in a simple and practical way.
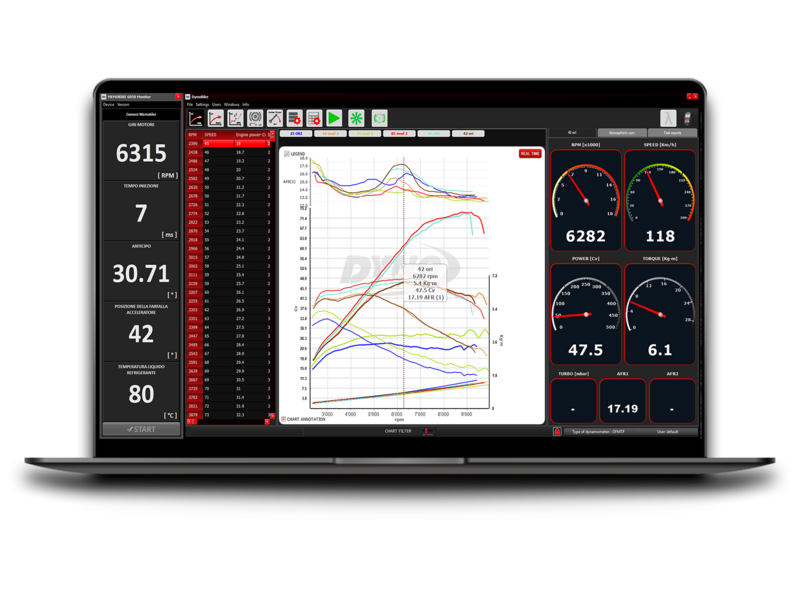
🚗 What is a Dyno Graph?
A dyno graph is a visual representation of your vehicle’s performance, generated using a dynamometer.
It shows:
- Power (Horsepower)
- Torque
- Engine speed (RPM)
- Sometimes AFR (Air-Fuel Ratio) and load
👉 It helps analyze engine performance before and after tuning
📊 Basic Structure of a Dyno Graph
A typical dyno graph includes:
🔹 Horizontal Axis (X-Axis)
- Represents engine speed (RPM)
- Example: 6 = 6000 RPM
🔹 Vertical Axis (Y-Axis)
- Left side → Power (HP)
- Right side → Torque (Nm)
🔹 Graph Lines
- Solid line → Power curve
- Dotted line → Torque curve
👉 Some dynos may display them separately
🔧 How to Read a Dyno Graph (Step-by-Step)
Let’s say you want to find values at 5500 RPM.
Step 1:
Locate 5.5 on X-axis (5500 RPM)
Step 2:
Move vertically up to:
- Torque curve
- Power curve
Step 3:
Read values from:
- Right axis → Torque
- Left axis → Power
Example:
At 5500 RPM:
- Torque ≈ 230 Nm
- Power ≈ 150 HP
👉 This is the basic method
⚙️ Understanding AFR & Load Graphs
Some dyno graphs include additional data:
🔹 AFR (Air-Fuel Ratio)
- Indicates combustion efficiency
🔹 Load
- Engine demand level
Example:
At 5500 RPM:
- AFR ≈ 12.9
- Load ≈ 0.7
👉 These help in fine tuning
🎨 Multiple Dyno Runs Explained
When multiple runs are taken:
- Each run is shown in different colors
- Run numbers are displayed
👉 Useful for:
- Before vs after tuning
- Comparing changes
🔍 What is Smoothing Factor (S.F)?
You may see:
👉 S.F. (Scaling Factor): STD Smoothing: 5
Meaning:
- 1 = Normal view
- 5 = Zoomed / smoothed graph
👉 Higher value = more detailed view
⚠️ Factors That Affect Dyno Results
Dyno results are not always identical—even for the same car.
🌡️ Weather Conditions
- Temperature
- Humidity
- Air pressure
👉 Cooler air = better performance
🌍 Altitude
- Higher altitude → less oxygen
- Lower power output
🧑 Driver Skill
- Gear shifting
- Throttle control
🔧 Vehicle Setup
- Tire condition
- Dyno setup
- Calibration
👉 All these affect results
⚙️ What is Dyno Calibration?
Dyno machines apply correction factors to adjust for:
- Weather changes
- Environmental conditions
👉 This ensures more accurate results
🔥 What is Powerband?
One of the most important concepts in dyno graphs.
🔹 Definition:
Powerband = RPM range between:
- Peak torque
- Peak power
Example:
- Peak torque at 4400 RPM
- Peak power at 5560 RPM
👉 Powerband = 1160 RPM
✔ Ideal Powerband:
- Narrow and efficient
- Smooth power delivery
❌ Poor Powerband:
- Large gap
- Performance drop
👉 Important for tuning optimization
⚠️ Common Mistake: Focusing Only on Peak Numbers
Most people only check:
- Maximum horsepower
- Maximum torque
❌ Why This is Wrong:
Peak numbers don’t show:
- Real driving performance
- Power delivery consistency
✔ What You Should Focus On:
- Area under the curve
- Average performance
- Smoothness of graph
👉 This is the correct way to analyze dyno results
🚗 Dyno Graph in Stage Tuning
After tuning (Stage 1, 2, 3):
- Power curve increases
- Torque curve shifts
- Powerband improves
👉 Dyno graph helps verify tuning success
⚙️ Dyno Graph for Turbo Cars
In turbocharged engines:
- Torque peak depends on turbo spool
- Faster spool = earlier torque
👉 Important tuning factor
🇮🇳 Dyno Graph Analysis in India
✔ Common Use Cases
- ECU remapping
- Performance testing
- Stage tuning validation
✔ Popular Cars
- Volkswagen / Skoda
- Hyundai turbo cars
- BMW / Audi
✔ Challenges
- Limited dyno access
- Environmental variations
📈 Who Should Learn Dyno Graph Reading?
✔ ECU Tuners
✔ Workshop Owners
✔ Performance Enthusiasts
👉 Essential skill for automotive professionals
🔑 Final Verdict
Reading a dyno graph is not difficult—but requires understanding.
✔ Key Takeaways:
👉 Focus on curves, not just numbers
👉 Understand powerband
👉 Compare before & after runs
🏁 Conclusion
Dyno graphs are one of the most powerful tools in ECU tuning. They provide real insights into engine performance and help tuners make informed decisions.
For Indian tuners, mastering dyno graph reading can significantly improve:
- Tuning accuracy
- Customer results
- Business growth
📺 Watch a real battery testing demo here: Reynlab YouTube Channel
🌐 Explore our automotive training programs: www.reynlab.com/our-courses